Morgan Stanley News: 10-Q Shows $960B in Completed M&A This Year
Morgan Stanley's third-quarter 10-Q shows advisory revenue up 30% to $887 million, weaker underwriting and $960 billion of completed M&A volume this year.
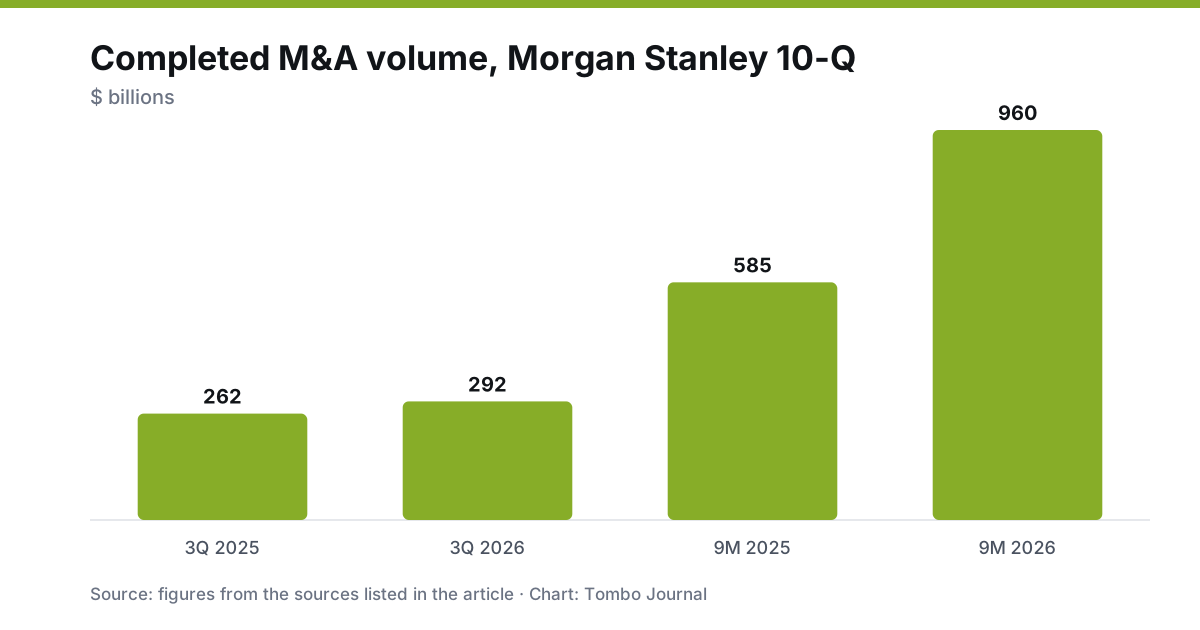
NEW YORK — Morgan Stanley’s investment bank earned more from advising on deals in the third quarter and less from underwriting them, a split laid out in the firm’s Form 10-Q filed with the SEC on Nov. 5. The report also carries the volume tables bankers use to describe their position in the market, and they show completed mergers and acquisitions advised by the firm reaching $960 billion over nine months.
Advisory up, underwriting down
Investment banking net revenue in the Institutional Securities segment was $2.16 billion, up 2% from a year earlier. Advisory revenue was $887 million, up 30% from $684 million, which the filing attributes to higher completed M&A activity, particularly in the Americas.
Underwriting moved the other way. Total underwriting revenue fell 11% to $1.27 billion. Equity underwriting was $525 million, down 19%, as lower initial public offerings and secondary block trades outweighed higher follow-on offerings. Fixed income underwriting was $747 million, down 3%, which the filing describes as modestly lower while citing continued strength in investment grade and non-investment grade issuance.
For the nine months, the picture is stronger. Investment banking revenue was $6.71 billion, up 29%, with advisory up on completed M&A, equity underwriting higher on initial public offerings, follow-on offerings and convertibles, and fixed income underwriting higher on investment grade and non-investment grade bond issuance.
The volume tables behind league-table claims
Banks publish transaction volume because it is the raw material of a league table: the ranking of advisers and underwriters by deal value credited to each. Morgan Stanley’s 10-Q draws its figures from LSEG Data & Risk Analytics as of Oct. 1, 2026, and cautions that volumes may not track net revenues in any given period.
| Volume, in $ billions | 3Q 2026 | 3Q 2025 | 9M 2026 | 9M 2025 |
|---|---|---|---|---|
| Completed mergers and acquisitions | 292 | 262 | 960 | 585 |
| Equity and equity-related offerings | 30 | 24 | 94 | 61 |
| Fixed income offerings | 93 | 96 | 383 | 290 |
The M&A figure counts transactions of $100 million or more, with full credit to each adviser on a deal. Equity credit goes fully to single book managers and is shared equally among joint book managers. Because of those conventions, adding up several banks’ volumes yields far more than the value of deals done, a point that matters when reading any ranking.
The jump in completed M&A volume is a statement about deals that closed, so it can run ahead of or behind the announcement data that league tables often feature.
Trading and the rest of the firm
Equity sales and trading, not banking, drove the quarter. Equity net revenue rose 41% to $5.80 billion, while fixed income net revenue fell 7% to $2.01 billion. Institutional Securities net revenue was $10.03 billion, up 18%, and segment net income was $2.70 billion.
Firmwide, Morgan Stanley reported net revenue of $20.3 billion, up 12%, and net income applicable to the firm of $4.9 billion, up 6%, or $3.03 per diluted share. Return on equity was 17.8% and return on tangible common equity was 22.6%. Wealth Management added $232 billion of net new assets in the quarter on net revenue of $9.1 billion, with a pre-tax margin of 30.4%.
Capital and buybacks
The Standardized common equity Tier 1 ratio was 14.9% at Sept. 30. The firm repurchased $1.54 billion of common stock under its repurchase authorization in the quarter and $4.79 billion for the nine months, compared with $1.09 billion and $3.09 billion a year earlier. On June 24, 2026, the board reauthorized a multi-year program of up to $20 billion with no expiration date, beginning in the third quarter and subject to Federal Reserve limits on distributions.
What to watch
The gap between a 30% advisory gain and an 11% underwriting decline will narrow or widen depending on whether the IPO and block-trade activity that weighed on equity underwriting returns in the fourth quarter. Year-end volume rankings from LSEG, and the firm’s next set of fee disclosures, will show how much of the $960 billion in completed M&A converts into revenue.
Prepared with AI assistance from public sources and reviewed under our editorial policy. Not investment advice.